


For the past couple of years, I have spent more time than I care to admit reviewing California’s student assessment results, comparing school districts, and working through the California School Dashboard. I was looking forward to the 2026 release because it shows where performance is improving, holding steady, and where schools still have work to do. California doesn’t make this easy to follow, but those reports contain useful information.
The 2026 CAASPP results and California School Dashboard were released today, and many of the findings are encouraging.
Laguna Beach Unified is once again the highest-performing unified school district in Orange County in both English language arts and mathematics. The district improved in both subjects, most schools had substantial academic gains, and the Dashboard shows continued progress in mathematics achievement, college and career readiness, graduation, and outcomes for students who require more support.
In English language arts (ELA), 78.35% of LBUSD students met or exceeded state standards, up from 77.53% in 2025. Mathematics proficiency rose from 72.13% to 73.28%. Both results are well above Orange County averages of 59.16% in English and 50.20% in mathematics, placing Laguna more than 19 points ahead in English and 23 points ahead in math.
Among Orange County’s 12 unified school districts, Laguna ranks first in both subjects, ahead of Irvine, Los Alamitos, Capistrano, and Newport-Mesa. For a district of about 2,300 students, maintaining this level of performance is an accomplishment, especially given how our students perform across the full range of achievement levels.
I have written previously about the tendency to treat CAASPP percentages as conventional classroom grades, which has led to creative interpretations of Laguna Beach High School’s mathematics results. California made a helpful change this year by updating the names of its four achievement levels, though the scoring thresholds remain the same.
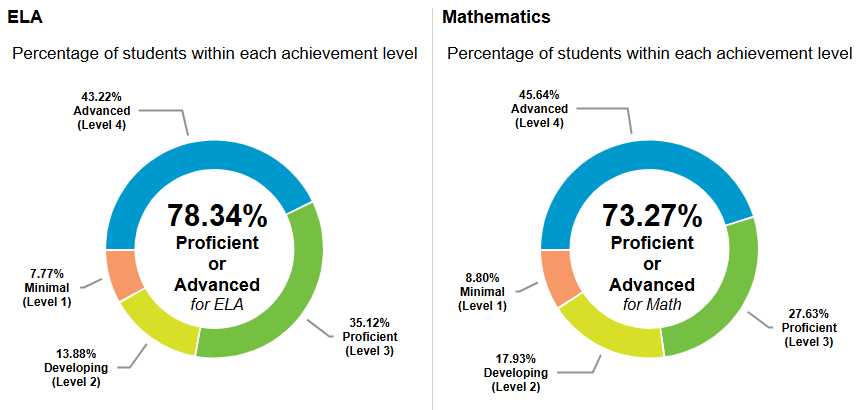
Level 4, previously called Standard Exceeded, is now Advanced. These students demonstrate sophisticated grade-level knowledge and skills, including applying their understanding to complex problems. Level 3, formerly Standard Met, is now Proficient, indicating students demonstrate the knowledge and skills expected at their grade level. Level 2, previously Standard Nearly Met, is now Developing, meaning students show an initial understanding of grade-level concepts but have not reached the state’s proficiency threshold. Level 1, formerly Standard Not Met, is now Minimal, indicating students demonstrate limited grade-level knowledge and skills and may need more academic support.
The percentages reported in the headlines combine students at Levels 3 and 4, showing how many reached proficiency, but the distribution across all four levels gives a more complete picture of academic achievement. These performance levels also serve a different purpose from classroom grades, which include coursework, assignments, assessments, and other measures of student progress.
Looking at Laguna’s full distribution, 43.22% of students scored Advanced in English language arts, while 45.64% scored Advanced in mathematics. Nearly half of the district’s tested students are achieving the highest level in math, with another 27.63% reaching Proficient.
I find the numbers at the opposite end of the scale particularly interesting.
In 2026, only 7.77% of LBUSD students scored Minimal in English, and 8.80% scored Minimal in mathematics. Across Orange County, those figures were 21.74% and 28.21%, respectively. Statewide, 29.02% of students scored Minimal in English and 38.18% in mathematics.
Laguna’s share of students scoring at the lowest level is less than one-third of Orange County’s and less than one-quarter of California’s. That is an encouraging result when considering academic assistance needs identified through the district’s Local Control and Accountability Plan, or LCAP, which I examined in detail earlier this year.
Students in the lowest group still require focused attention, and the district should keep evaluating how effectively its interventions help them develop fundamental skills. The small share of students at Level 1, combined with the large share achieving Advanced, tells us more about overall academic achievement than the proficiency rate alone.
Laguna Beach High School provides a useful example of how easily these numbers can be misunderstood.
In 2026, 60.39% of LBHS juniors scored Proficient or Advanced in mathematics, up from 59.51% in 2025 and well above the Orange County grade 11 average of 41.85%. Of the 207 students who received mathematics scores, 67 scored Advanced, 58 Proficient, 51 Developing, and 31 Minimal.
The recurring claim that about 40% of Laguna Beach High juniors are failing mathematics lumps everyone below the proficiency threshold together and treats them as if they have identical academic needs and outcomes. Of the 82 students below that threshold, 51 were classified as Developing. Their results show they need to strengthen some mathematical skills, while other measures should evaluate classroom performance and course completion.
Approximately 15% of tested juniors scored Minimal, compared with nearly 38% across Orange County. High school mathematics proficiency should remain a focus, especially when comparing Laguna with top-performing schools such as Troy High and Northwood High, but these results do not justify presenting them as evidence of widespread academic failure.
The California School Dashboard offers context by showing how far students score above or below the proficiency threshold, rather than using only the percentage who reach it. This measure, called distance from proficiency, can reveal improvements in average academic performance although the proportion of students crossing the proficiency threshold changes little.
Districtwide, the average mathematics score increased from 46.1 points above the standard in 2024 to 47.5 points in 2025 and 53.2 points in 2026. English language arts returned to 64.3 points above proficiency, recovering from its 2025 decline and reaching its 2024 level.
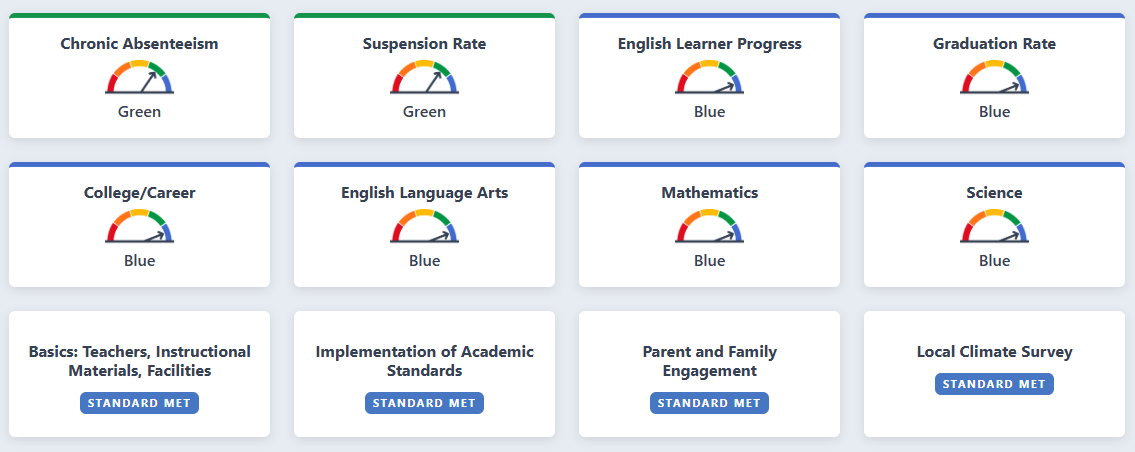
The district’s 2026 Dashboard reflects these broader outcomes. LBUSD earned Blue, the state’s highest performance category, in English, mathematics, science, English learner progress, graduation, and college and career readiness. Chronic absenteeism and suspension rates were both Green, leaving the district with no overall indicators in the Yellow, Orange, or Red categories.
The strongest individual school improvement this year came from El Morro Elementary, where mathematics performance increased by 18.1 scale-score points, from 36.5 points above proficiency to 54.6. The share of students achieving Advanced mathematics climbed more than nine percentage points to 48.47%. English proficiency rose to 77.55%, science performance improved, and chronic absenteeism fell from 12.6% to 9.8%.
Both English and mathematics moved from Green to Blue on the Dashboard, and the school now slightly exceeds Top of the World in mathematics proficiency. After reviewing El Morro’s 2024 and 2025 results, especially last year’s decline in mathematics, this is one of the most encouraging developments in the new data.
Instructional decisions, classroom practices, intervention methods, and many hours of work drove these improvements. The assessment files cannot identify which efforts produced the gains, but the results give us strong reason to learn more about what El Morro’s teachers and staff have done and to recognize the achievement.
Thurston Middle School is another example of why examining multiple years and performance measures is worthwhile.
Its overall mathematics proficiency remained strong at 73.65%, while English proficiency was 76.63%, earning Blue in both subjects. Although proficiency rates changed little from 2025 to 2026, the Dashboard shows Thurston’s average mathematics performance rose from 40.3 points above proficiency in 2024 to 52.2 in 2025 and 58.8 in 2026.
That represents an 18.5-point improvement over two years. Thurston also earned an Accelerated mathematics growth rating under the Dashboard’s new student-growth measure, which evaluates eligible students’ progress relative to peers with similar prior achievement.
Its suspension rate declined substantially, from 7.4% in 2024 to 3.3% in 2025 and 1.1% this year. Chronic absenteeism increased slightly and is worth monitoring, but Thurston’s academic performance, mathematics growth, and reduced suspensions are encouraging for the school community.
Laguna Beach High School also showed important academic improvement this year. English proficiency increased from 79.32% to 82.86%, while its average mathematics performance increased by 6.3 scale-score points. The high school moved from Green back to Blue in English and mathematics, and science performance also increased.
Mathematics proficiency remains relatively flat, and the school’s average mathematics performance has not fully recovered to its 2024 level. This needs attention, but overall high school outcomes are impressive, especially given measures of student preparation beyond the eleventh-grade assessments.
In 2026, 87.3% of Laguna Beach High students in the relevant graduation cohort were classified as college- and career-prepared, compared with 55.2% statewide. The school’s graduation rate reached 100%, compared with California’s 88.1%.
These measures cover different student cohorts and evaluate different outcomes, but together they provide important insight into academic preparation, course completion, and post-graduation opportunities. They also reflect the range of educational pathways available at LBHS, including Advanced Placement, career technical education, dual enrollment, arts, athletics, and the many support services outlined in the LCAP.
Top of the World Elementary continues to demonstrate strong overall achievement, although its 2026 results warrant a closer look. English proficiency was 78.49% and mathematics proficiency 78.85%, both down modestly from 2025. The Dashboard showed more noticeable declines in average performance, with English decreasing 6.2 scale-score points and mathematics declining 5.4 points, moving both indicators from Blue to Green.
Despite those changes, nearly half of Top of the World’s tested students achieved Advanced mathematics performance; science remained Blue, and the school earned an Accelerated mathematics growth rating. The school continues performing at a high level, but the district should evaluate whether recent declines are concentrated in certain grade levels or achievement groups.
The Dashboard also offers encouraging evidence that academic progress is reaching students who have historically experienced greater challenges. Districtwide, socioeconomically disadvantaged students improved their average mathematics performance by 20.7 scale-score points, students with disabilities improved by 30.8 points, and English learners improved by 25.2 points.
Students with disabilities remain below the districtwide proficiency benchmark on average, and some groups experienced declines, including Hispanic students in mathematics. These results call for continued attention to academic interventions, fund allocation, and sustaining improvements across multiple years. The district’s English learner progress indicator also returned to Blue, with 75.8% of eligible students making progress toward English proficiency, compared with 47.4% statewide. The new mathematics growth indicator classified districtwide growth in eligible grades as Accelerated, providing another useful measure of how students are progressing over time.
Taken together, the results are meaningful because they reflect gains in academic proficiency, average achievement, student growth, and outcomes for student groups receiving additional support. That is the kind of evidence we should examine when evaluating the district’s LCAP goals, instructional strategies, and investments in student services.
Student engagement and school climate also improved. Districtwide chronic absenteeism decreased from 8.8% to 8.1%, and the suspension rate fell from 1.7% to 1.3%. The 2026 Dashboard reports 88% of surveyed students identified at least one supportive adult at school, while 82% reported participating in challenging learning activities.
These measures reflect the work across our schools, including counselors, intervention specialists, special education professionals, classified employees, instructional aides, administrators, and teachers who spend their days finding ways to reach students with different abilities and needs.
I think about the work behind these results, especially in a small district where individual students and small cohorts can drive annual percentages. Improving mathematics proficiency by more than 11 points at an elementary school, sustaining accelerated growth at a middle school, and strengthening academic and postsecondary outcomes at a high school require deliberate effort and coordination. These accomplishments rarely happen because someone updated a strategic plan or approved another PowerPoint.
The people working directly with students deserve recognition for the progress reflected in these reports, just as the district has a responsibility to understand which efforts are producing results and where more support is needed.
Having worked through the data for the last couple of years, I am encouraged by what the longer view reveals. Laguna Beach Unified continues to lead Orange County’s unified districts in statewide academic proficiency, while individual schools demonstrate measurable improvement in areas that warrant recognition. There are legitimate concerns to examine, but those concerns exist within a district producing exceptionally strong academic and college-readiness outcomes.
Laguna Beach Unified has earned its place again among Orange County’s top unified districts. The 2026 results give us clear areas to improve, substantial gains to build upon, and plenty of reasons to recognize the teachers and staff doing the work.
We are capable of doing all three.
Erika, I continue to be so grateful for your common sense translation of important information that others seem to flippantly evaluate through Chat GPT and think they know what they’re talking about.
Evaluation of student outcome data needs nuanced understanding of how the information is gathered, analyzed and reported. Some in our community wouldn’t understand nuance if it hit them in the face.
Thank you! 🙏🏼
Thank you, Erika, for always separating fact from fiction and providing context. As it relates to Troy (and schools like Oxford Academy), Troy has a magnet program called Troy Tech (established in 1986), and I taught there at the beginning of my career in 1992. It's a highly selective program that tests prospective 8th graders from all over Orange County in January for admission, and it's a four year STEM program alongside a traditional education. They frequently win or place high in the National Science Olympiad, so there are lessons to learn from Troy and their very successful STEM programs, but it would be unfair to compare the two high schools in that regard due to their admission screening for the program. I know you are not doing that in this piece, but for anyone curious about their scores, here's context. Oxford Academy is the same: a highly selective charter school that has an admissions process.